Figure export in typical formats (.fig, .png, .jpeg, .pdf, .bmp)
Script-based execution using MATLAB scripts simplifies integration into tool chains
Visualization
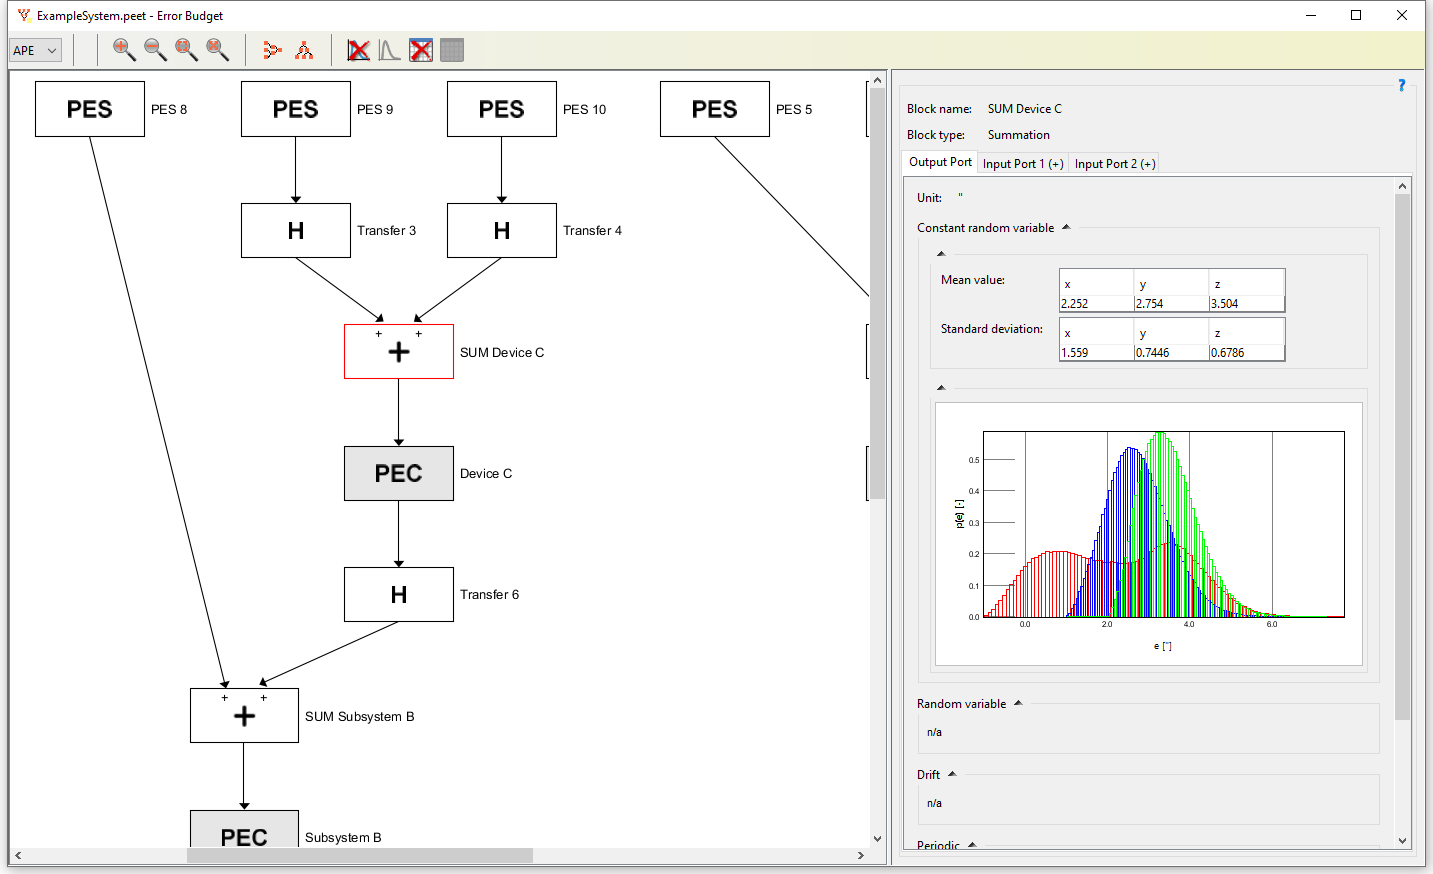
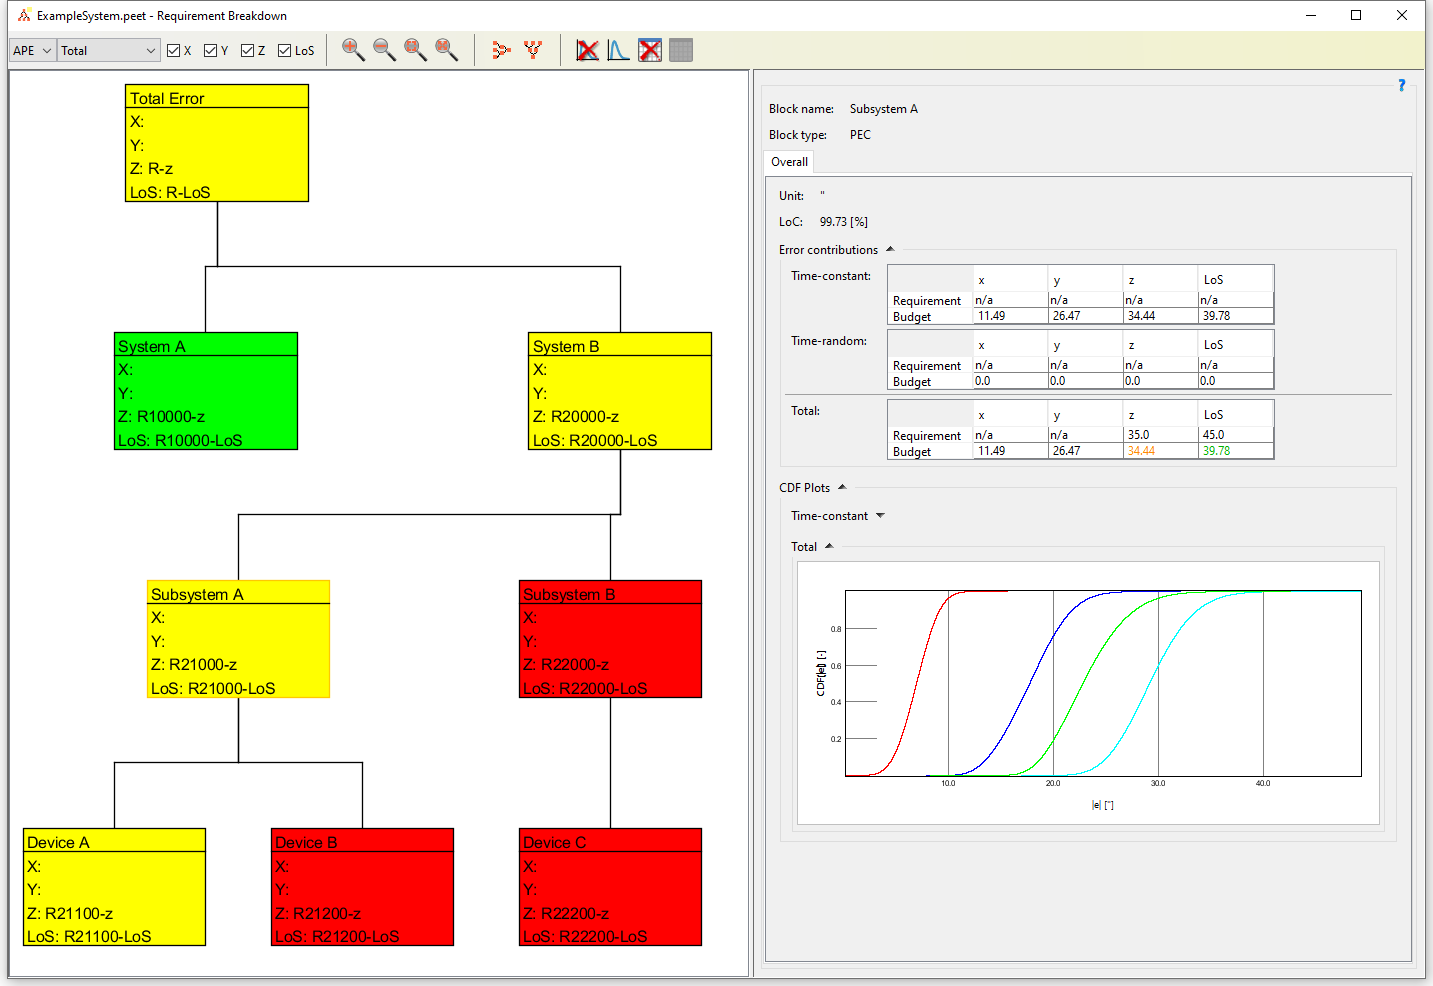
Error signal analysis and requirement compliance in dedicated tree view that represent the system/requirement structure
Various plot types for probability densities, probability function, correlation and power spectra
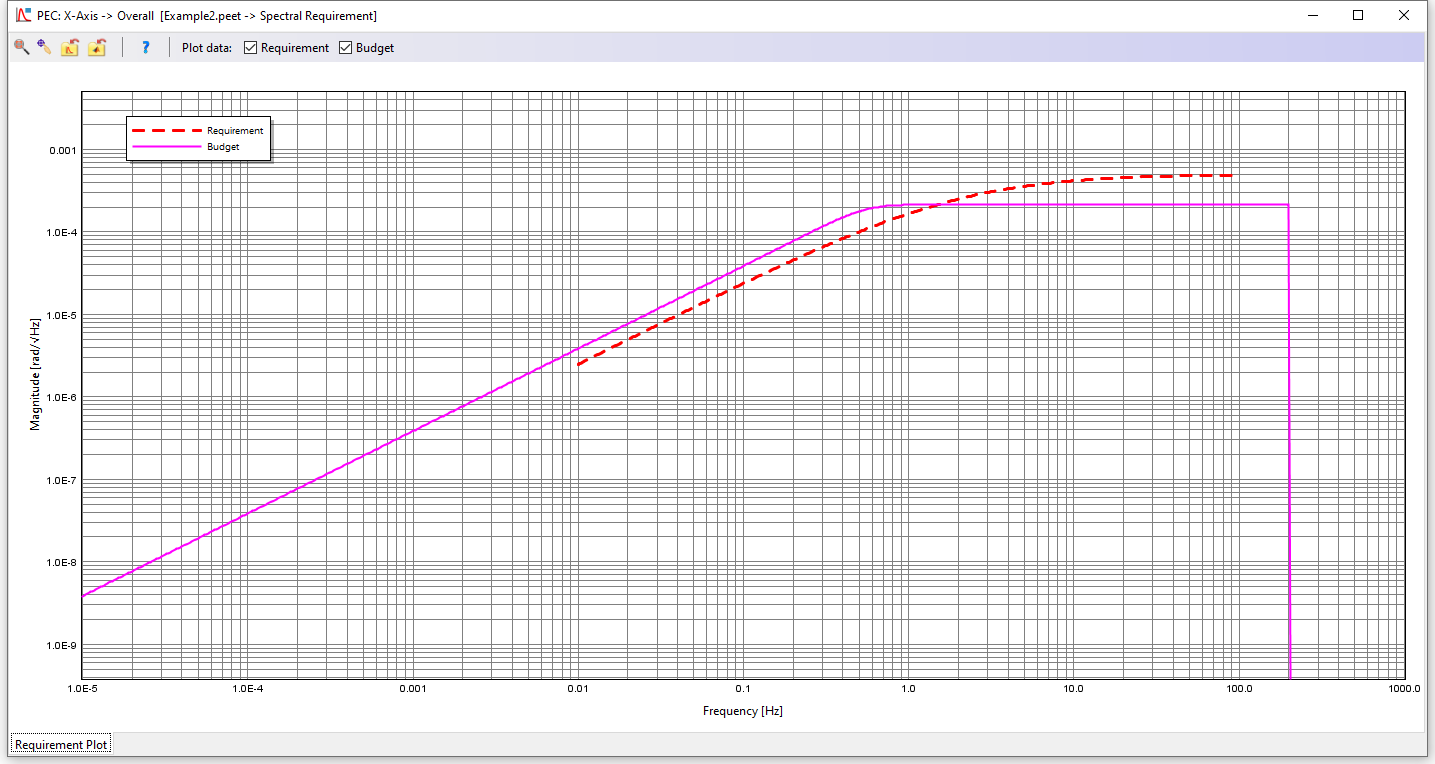
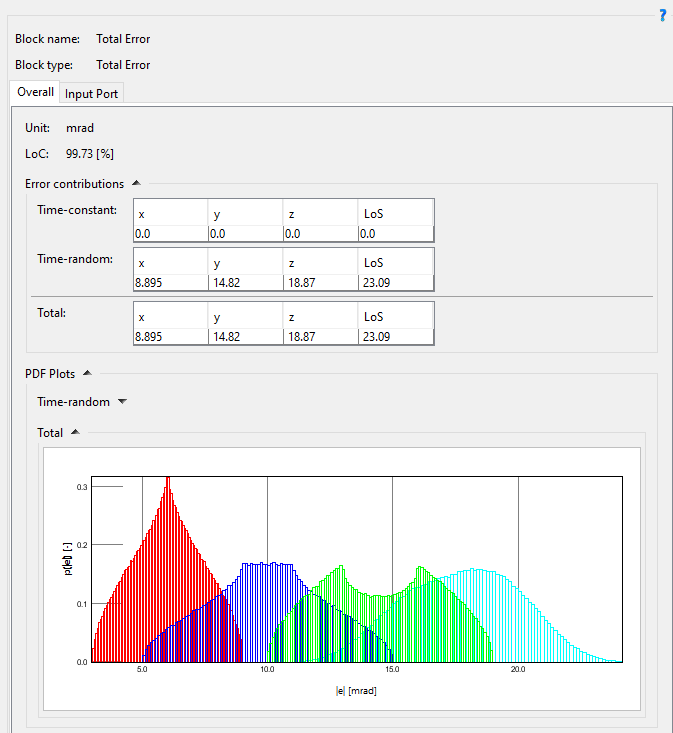
The Budget Tree View: Analysing error signal propertiesThe Breakdown Tree View: Checking compliance with requirementsExemplary: Spectral budget versus requirement functionExemplary: Statistical “3-Sigma” requirement with resulting budget contribution on x-,y-,z-axes and line-of-sight and corresponding probability density functions
MATLAB is a registered trademark of The Mathworks, Inc.
Excel is a registered trademark of the Microsoft Corporation.